
GPT-4 Algotrading Guide Part 2: Back Testing
Turn GPT-4o Into a Money Printing Machine by Creating an Army of Bots That Trade For You While You Sleep

Have you ever came across a trading strategy on Youtube, Twitter, or IG that just seemed TOO GOOD TO BE TRUE?
Or have you ever came across a trading strategy that you wanted to automate, so that you can frolic in the meadows with your friends or spend time with your mistress and secret family?
(Check out how I turn ChatGPT-4 into an endless fountain of trading ideas HERE)
In this guide, I’m going to show you how anyone. I mean ANYONE, even you. Yes you, can turn a trading idea into a trading bot that can trade for you.
For our purposes today we are going to test the MACD strategy from this video with over 2 million views that claims to have an 86% win rate. Rules at 4:20 mins
BEST MACD Trading Strategy [86% Win Rate]
Step 1: Write Down the Rules in Plain English
Define the rules:
If price is in an UPTREND and MACD is BULLISH, then BUY and set STOP LOSS at below the 200 EMA and set PROFIT TARGET at 1.5x the stop loss.
If price is in a DOWNTREND and MACD is BEARISH, then SELL SHORT and set STOP LOSS at above the 200 EMA and set PROFIT TARGET at 1.5x the stop loss.
Define terms:
Filter:
Uptrend: Close is above 200 EMA.
Downtrend: Close is below 200 EMA.
Trigger:
Bullish: MACD histogram crosses above 0.
Bearish: MACD histogram crosses below 0.
Step 2: Use Copilot GPT to Turn It Into Code
Click on Explore GPTs and select Code Copilot
The Prompt:
Develop an EasyLanguage strategy that trades futures markets using the following rules:

Entry/Exit Rules:
- If price is in an UPTREND and MACD is BULLISH then buy. Set stop loss at below the 200 EMA. Set profit target of 1.5 x Stoploss
- If price is in a DOWNTREND and MACD is BEARISH then sell short. Set stop loss at above the 200 EMA. Set profit target of 1.5 x Stoploss

Filter:
- Uptrend: Close is above 200 EMA.
- Downtrend: Close is below 200 EMA.
- Support: Low crosses below lowest low of last N bars and closes above the lowest close of the last N bars

Trigger:
- Bullish: MACD lines are below 0 and histogram crosses above 0.
- Bearish: MACD lines are above 0 histogram crosses below 0.

Reference this example on how to properly code profit targets and stop losses in Easylanguage for this case. Its crucial to note that we must multiply any stoploss or profit target value by BigPointValue if we are trading futures:

StopLossValue = (Close - Low) * BigPointValue;
SetStopLoss(StopLossValue);
SetProfitTarget(1.5 * StopLossValue);
The Code:
Inputs:
    EMALength(200), // Length of the EMA
    FastLength(12), // MACD Fast Length
    SlowLength(26), // MACD Slow Length
    MACDLength(9);  // MACD Signal Length

Variables:
    EMA200(0),
    MACDValue(0),
    MACDSignal(0),
    MACDHist(0);

// Calculate the 200-period EMA
EMA200 = XAverage(Close, EMALength);

// Calculate the MACD and MACD Histogram
MACDValue = MACD(Close, FastLength, SlowLength);
MACDSignal = XAverage(MACDValue, MACDLength);
MACDHist = MACDValue - MACDSignal;

// Define the UPTREND and DOWNTREND
if Close > EMA200 then begin
    // UPTREND Condition
    if MACDHist crosses over 0 then
        Buy ("BuySignal") next bar at market;
end
else if Close < EMA200 then begin
    // DOWNTREND Condition
    if MACDHist crosses under 0 then
        Sell Short ("SellShortSignal") next bar at market;
end;
Step 3: Automate
Load the code onto a chart in Tradestation.
Open Tradestation
Right click anywhere in your workspace > Chart Analysis
Right click on chart > Timeframe > Customize
Apply the settings: Symbol @ES, Daily Bar, 30 years back
Right click on chart > Studies > Add Strategies > Select any Strategy > Edit Easylanguage (Opens TDE - Tradestation Development Environment)
[In TDE]
File > New > Strategy > Name: !FREE_ALGO_MACD > copy/paste The Code > Press F3 (to verify)
Right click on chart > Studies > Add Strategies > Select !FREE_ALGO_MACD > Click Properties for all > Commissions: $2.04, Slippage: $12.50, select Per Contract/Share > OK, Close
Right click on chart > Data > Strategy Performance Report
Analysis
27 year back test of the MACD & 200 EMA strategy on @ES
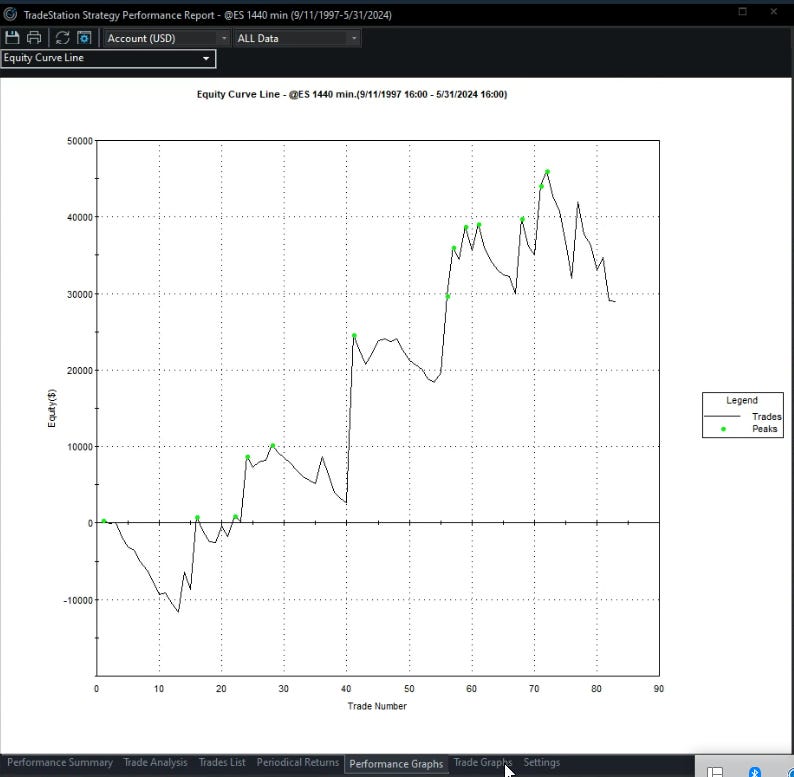
I see 3 red flags:
Low trade count
Large drawdowns
Lost money last 5 years, when the market @ES has been trending up
Has an appalling win rate of 32% instead of the advertised 86%
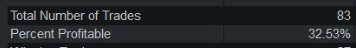

This supposedly is a trend following strategy, so lets see if it works on a trending market like @CL. Here’s the 23 year back test
This strategy used to work well on CL until 2016, since then its lost money every year.
Some of you might have noticed in the video, they mention adding support and resistance, and I didn’t include this in the code/back test for a couple reasons.
Support/resistance lines are subjective. Easy to draw with hindsight, but difficult to define explicitly
The trade count is already so low, that if I add an additional filter the back test would have less than 50 trades, and we need over 600+ trades in back test to have statistic significance.
I did code it and test it out and it didn’t improve performance
MACD as a Filter
Perhaps the MACD is better used as a filter for a strategy that already works? Lets test it a trending strategy that already works:
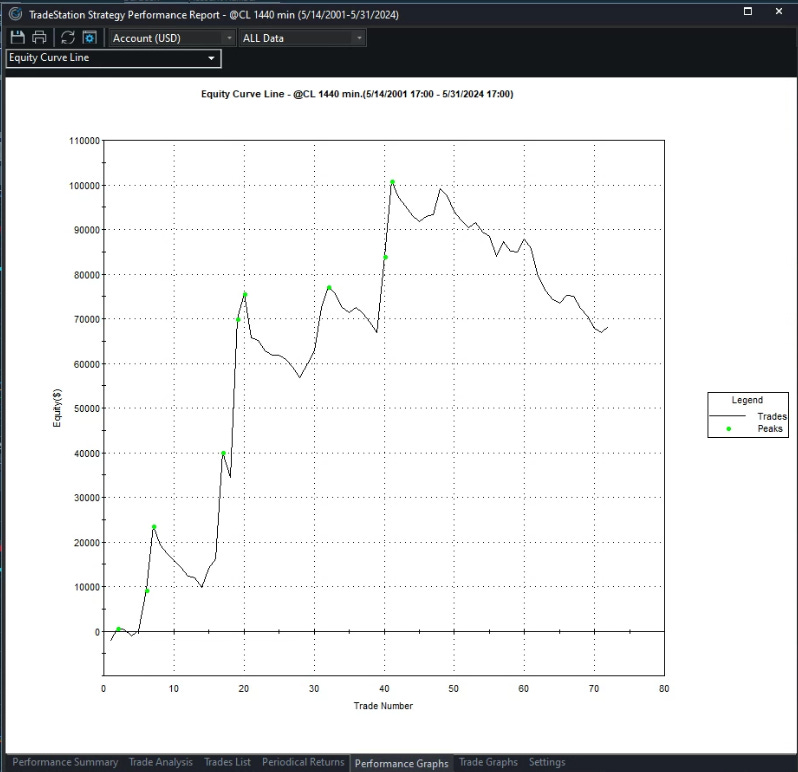
My BREAKOUT 50 algo (get the code for FREE HERE)
Here’s the original strategy’s back test
Here’s the back test with the MACD as a filter:
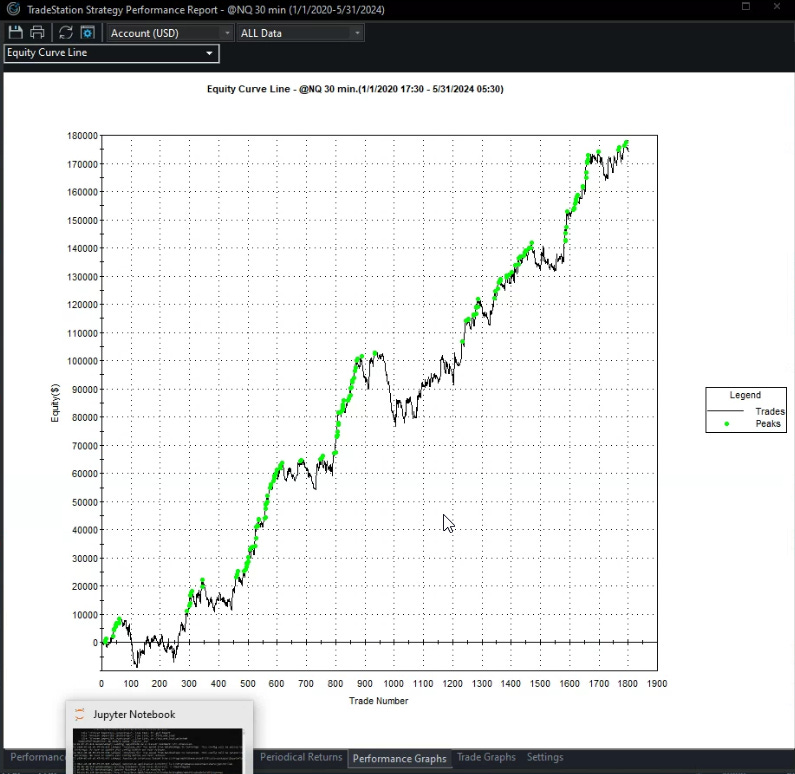
Noticeably worse…
Imagine if you had just blindly traded this strategy.
You’d have lost money every year since the video was released 2 years ago.
This is why my motto in trading is: TEST EVERYTHING.
Hope you found this helpful. Until next time friend.